By Franco (2020)
A STATISTICAL LOOK AT THE USA 2020 ELECTION
Alphee Lavoie’s Astrological Investigators try to prove out astrological theories by using statistical methods and Artificial Intelligence by the use of Neural Nets. Our website is www.astroinvestigators.com
The traditional method for predicting an election is to look at the chart for the seasonal ingress of Sun for the time the election is held. In the USA, elections occur on the first Tuesday of November, every four years. That means we should look at the solar ingress into Libra.
Normally, one would look at the strengths of the tenth house (government) and the fourth house (opposition) and try to determine which is stronger. I instead examined 9041 astrological events:
- house and sign positions of planets
- aspects
- aspects to house rulers
- house rulers positions
- Planetary speeds, retrogrades
- Interceptions
- Declinations
- Midpoints
- Planetary phases
Statistics: The model was created in Fast Research by Air Software by selecting events that had a Chi-square (X2) distribution of 2 or greater and using those in a Neural Net model. With the party wins, however, the Neural Net required a X2 of 1 or greater.
One difficulty with doing a statistical study like this one is the sample sizes are relatively small, so the margin of error can be large.
For more information, check out our video on YouTube:
https://www.youtube.com/watch?v=4p7kGHVjwAk&t=963s&ab_channel=AlpheeLavoie
INCUMBENT PARTY WINNER MODEL
As stated earlier, the seasonal ingress chart is used to determine if the ruling party will maintain the government for an election taking place within that season. For studying incumbent party wins (not the incumbent president but the party), I used incumbent party wins (26) as the study group, I used incumbent party loses (21) as a control group. For this group, I could go back to 1832, where there were at least one of the current parties was in existence.
NOTE: This model is designed to predict if the party the elected president is a member of would continue as the government.
The top 25 results that occurred in an Incumbent win are shown here.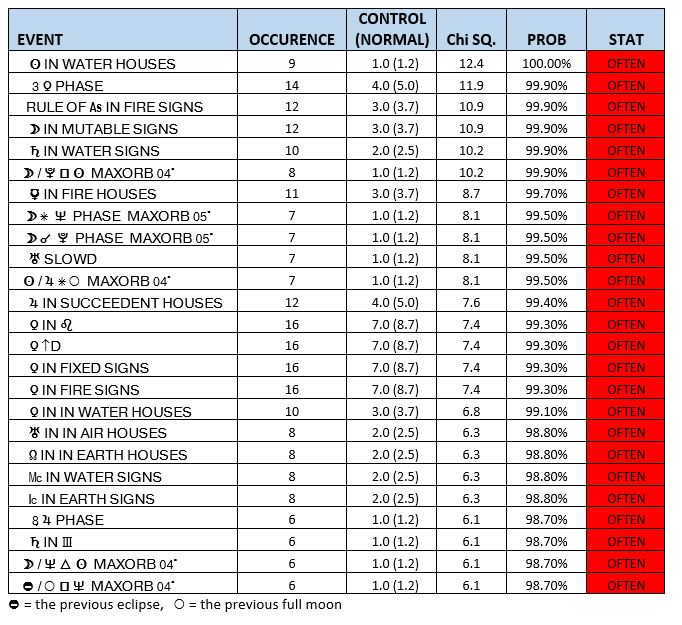
The top 25 results that occurred in an incumbent loss are shown here.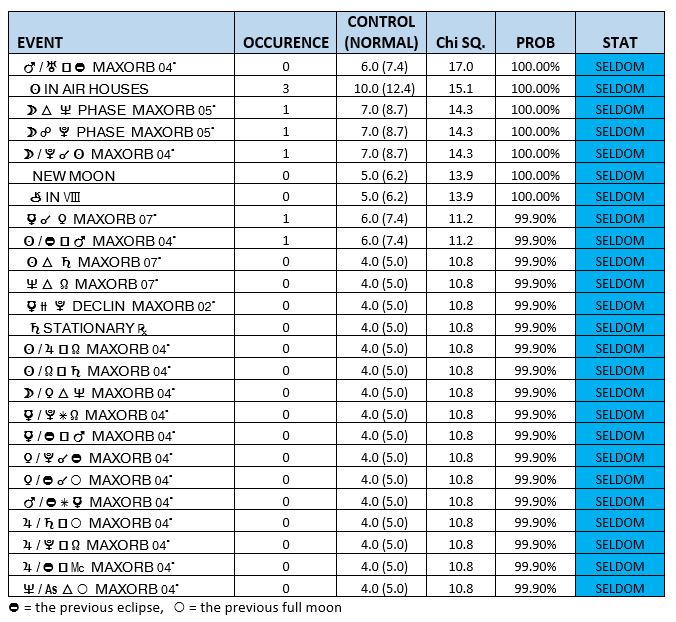
These results and more were used to create a Neural Net model. Once the model was created, the elections were run through the model. The model will predict an incumbent party win if the bar is RED or all the way across. If there is a thin BLUE bar and a lot of WHITE, then it is a loss for the incumbent party. Therefore, if we input a incumbent party loss, there should be NO RED.
The results show the model picked the incumbent win with 100% accuracy.
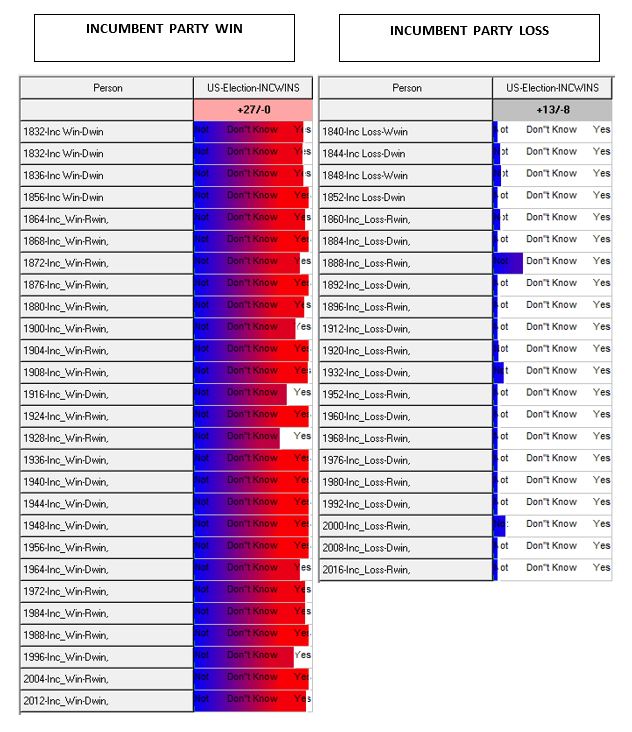
46% were predicted with 100% agreement with 47% with a greater than 85% agreement and only 2 or 7% being between 70% – 80%.
Plugging the Incumbent losses into the model shows 100% accuracy with 29% being less 100% certain, and only one or 5% being 70% certain.
REPUBLICAN VS DEMOCRAT MODEL
For studying presidential party wins, I used Republican wins (24) as the study group and Democratic wins (16) as a control group. I could only go back to 1860, where these two parties were against each other.
The top 25 results that occurred in a Republican win are shown here.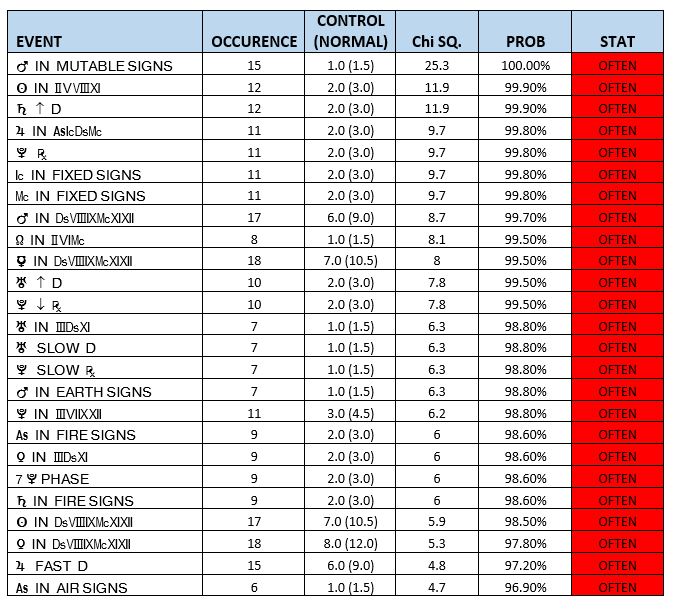
The top 25 results that occurred in a Republican loss or Democrat win are shown here.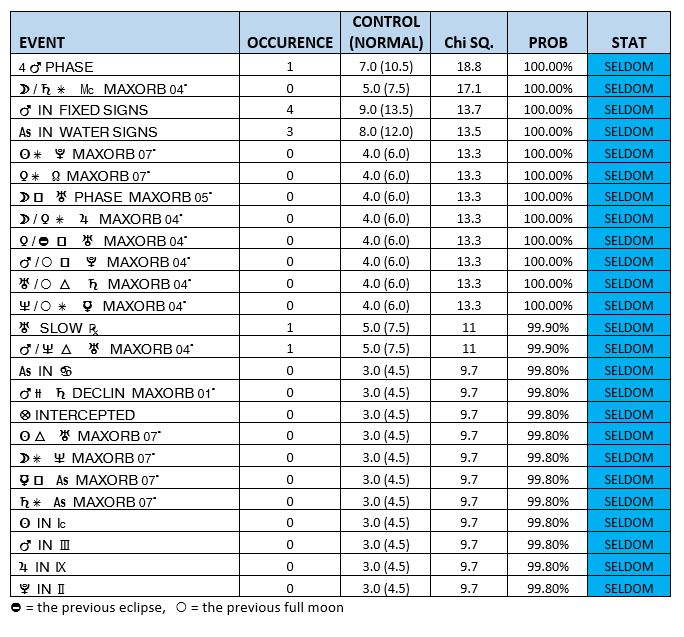
These results and more were used to create a Neural Net model. Once the model was created, the elections were run through the model. The model will predict a Republican president if the bar is RED or all the way across. If there is a thin BLUE bar and a lot of WHITE, then it is a Democrat presidential victory. Therefore, if we input a Democratic Presidential win, there should be NO RED.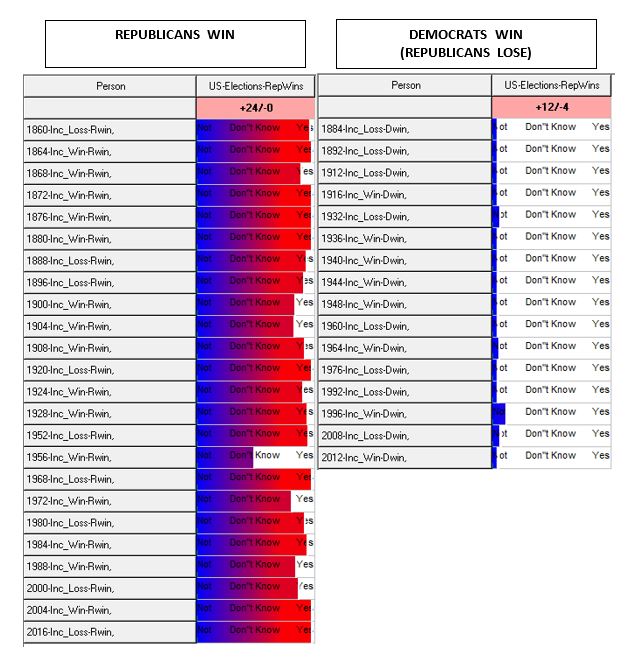
The results show the model picked the Republican wins with 95% accuracy.
33% were predicted with 100% agreement with 62% with a greater than 80% agreement and only 1 or 5% being a 50% undecided.
Plugging the Democrat wins into the model shows 100% accuracy with 25% being less 100% certain but over 90%.
2020 ELECTION
Now that we have created models based on past elections, we can try to determine who will win the election in 2020.
We will run the Libra Ingress chart for 2020 through the models.
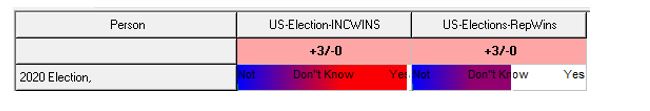
The results are predicting an incumbent win of 100% and 58% chance of a Republican win. The Neural Net Models predict a Republican victory or a Trump-Pence win.
Book an Astrological Reading
Want to find out more about how astrology affects you?